Effectively navigating Clario's Global Dashboard
- 05 Jun 2024
- 4 読む分
- 印刷する
- 闇光
- PDF
Effectively navigating Clario's Global Dashboard
- 更新日 05 Jun 2024
- 4 読む分
- 印刷する
- 闇光
- PDF
The content is currently unavailable in Ja - 日本語. You are viewing the default English version.
記事の要約
この要約は役に立ちましたか?
ご意見ありがとうございます
Overview
Access the Global Dashboard from anywhere in the Clario Portal by pressing the CLARIO. icon in the header.
Access your studies by pressing Select Study or Organization or by looking in your Recently Accessed projects.
Update your profile or log out by pressing your user name.
Click the Clario Apps icon to access apps associated with your profile.
Quickly navigate between Clario Services by using the service buttons (e.g., Clario Help).
Register your site, join a study, link your product accounts, and view announcements all from one location.
Expand for detailed instructions…
Finding your way around the header options
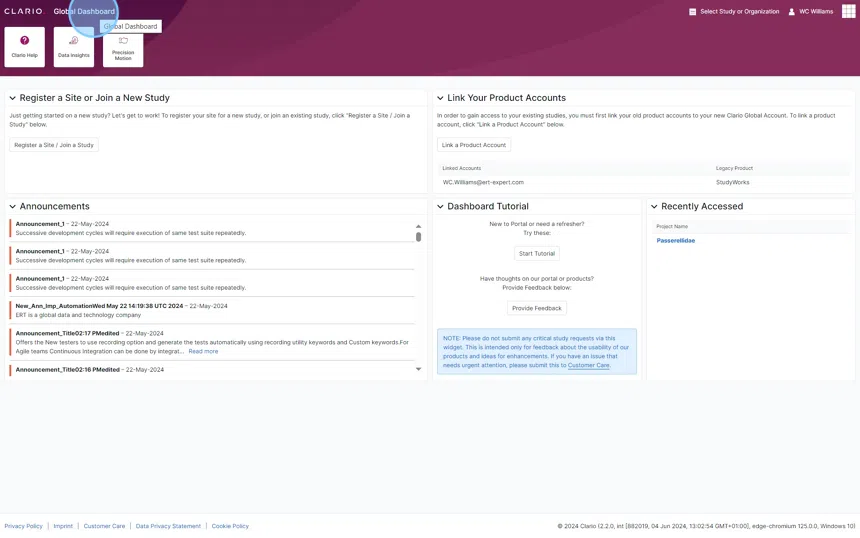
1. The CLARIO. logo shown in the top left corner of the screen is your home button. You can press this button from any page you're on to be brought directly back to Clario's Global Dashboard.
 - Step 1.png?sv=2022-11-02&spr=https&st=2025-04-25T19%3A41%3A45Z&se=2025-04-25T19%3A51%3A45Z&sr=c&sp=r&sig=myrYs03At0%2F2Hw%2BbnEMLVbN0dn4b7n7hZhdonlFC7jg%3D "How do I effectively navigate the Clario Global Dashboard_ (3) - Step 1.png")
2. The page title will always appear next to the CLARIO. logo. Knowing the page title will be important when you are following how-to instructions or troubleshooting with Clario's Customer Care team.
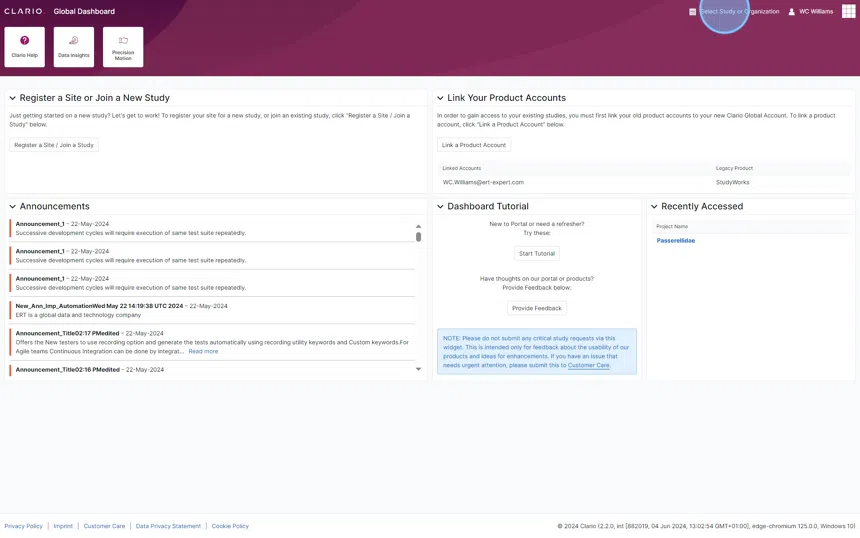
3. You can easily access your study or jump between studies if you're participating in multiple ones by using the study selector. Simply press Select Study or Organization to bring up a short list of studies. Select the desired study, if shown. If it is not shown, then press Show more....
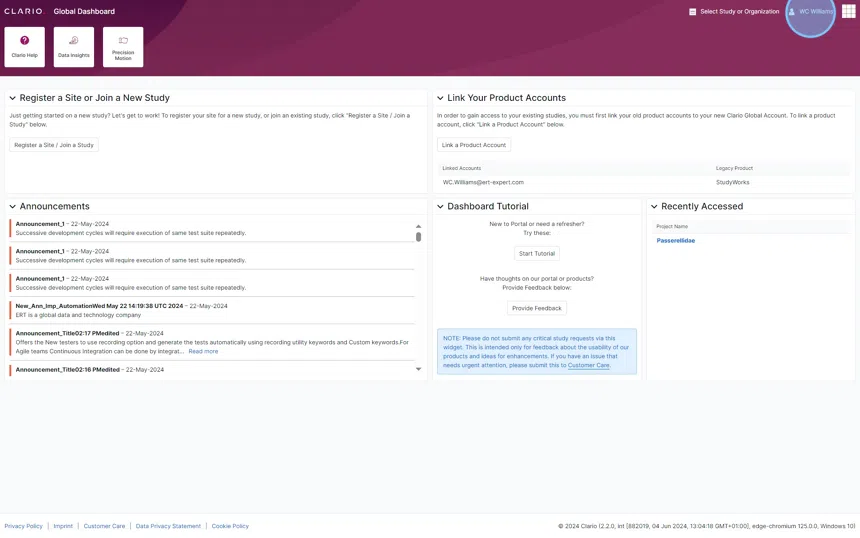
4. You can navigate to your profile and log out by selecting your user name. In the example below, the user name is "WC Williams". Your user name will always appear next to the Clario Apps menu in the top right corner of the Clario Portal screen. Simply select your user name to bring up the two clickable options.
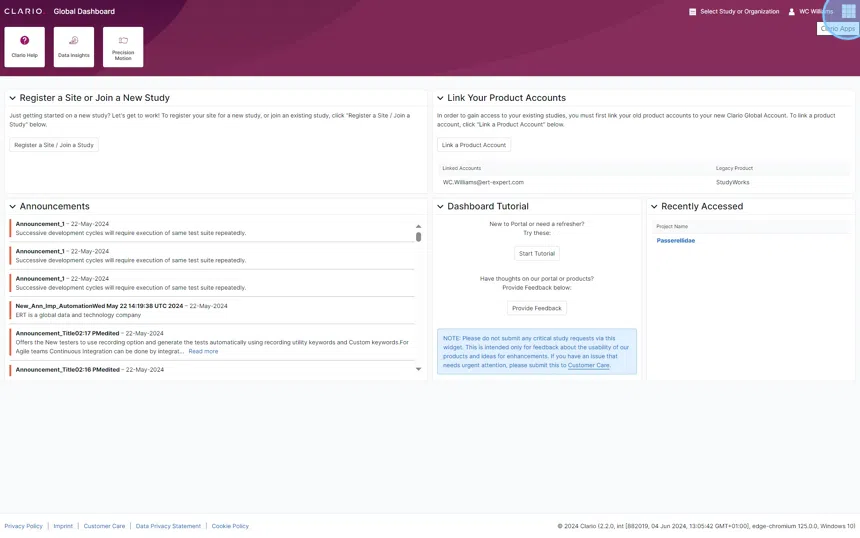
5. The Clario Apps menu is displayed in the top right corner of the Clario Portal screen. Click the waffle icon to bring up a list of the Clario Apps that are available to you. You can then launch any of those apps by selecting the corresponding icon.
Navigating to Clario Services
1. Each of the Clario Services that are available to you will be displayed as a large clickable button in the webpage header. When you select a Clario Service, you'll either be directed to a new web page or a separate tab will open.
 - Step 6.png?sv=2022-11-02&spr=https&st=2025-04-25T19%3A41%3A45Z&se=2025-04-25T19%3A51%3A45Z&sr=c&sp=r&sig=myrYs03At0%2F2Hw%2BbnEMLVbN0dn4b7n7hZhdonlFC7jg%3D "How do I effectively navigate the Clario Global Dashboard_ (3) - Step 6.png")
Understanding the main body of the Global Dashboard
The main body of the page is broken into five sections:
Register a Site or Join a New Study
Link Your Product Accounts
Announcements
Dashboard Tutorial
Recently Accessed
Let's briefly look at each of these sections.
1. We don't expect you to use this section too often. You'll select Register a Site / Join a Study only when you're getting started with your clinical trial. This action launches a series of screens that allows you to associate your Clario Global Account with a specific clinical trial.
You can also collapse this section by pressing the down arrow that is located next to the word "Register".
 - Step 10.png?sv=2022-11-02&spr=https&st=2025-04-25T19%3A41%3A45Z&se=2025-04-25T19%3A51%3A45Z&sr=c&sp=r&sig=myrYs03At0%2F2Hw%2BbnEMLVbN0dn4b7n7hZhdonlFC7jg%3D "How do I effectively navigate the Clario Global Dashboard_ (3) - Step 10.png")
2. In the event that you've worked with Clario or one of its legacy companies in the past (e.g., Bioclinica, ERT) and you have an old account with us, then click Link a Product Account to begin the process of associating that account with your Clario Global Account.
You can also collapse this section by pressing the down arrow that is located next to the word "Link".
 - Step 11.png?sv=2022-11-02&spr=https&st=2025-04-25T19%3A41%3A45Z&se=2025-04-25T19%3A51%3A45Z&sr=c&sp=r&sig=myrYs03At0%2F2Hw%2BbnEMLVbN0dn4b7n7hZhdonlFC7jg%3D "How do I effectively navigate the Clario Global Dashboard_ (3) - Step 11.png")
3. Announcements - Look here for important messages from Clario. If you missed an announcement, then don't worry! Simply scroll through the list of announcements to catch up.
You can also collapse this section by pressing the down arrow that is located next to the word "Announcements".
Expand to learn more about Announcements…
Some announcements could be lengthy, so you'll notice a clickable Read more link. Once clicked, the full announcement will appear at the top of the Global Dashboard screen in a pop-up message. Press x to close the message.
 - Step 12.png?sv=2022-11-02&spr=https&st=2025-04-25T19%3A41%3A45Z&se=2025-04-25T19%3A51%3A45Z&sr=c&sp=r&sig=myrYs03At0%2F2Hw%2BbnEMLVbN0dn4b7n7hZhdonlFC7jg%3D "How do I effectively navigate the Clario Global Dashboard_ (3) - Step 12.png")
4. The Dashboard Tutorial section allows you to click three different options. The first is Start Tutorial. When this is clicked a pop-up message appears at the top of the screen.
 - Step 13.png?sv=2022-11-02&spr=https&st=2025-04-25T19%3A41%3A45Z&se=2025-04-25T19%3A51%3A45Z&sr=c&sp=r&sig=myrYs03At0%2F2Hw%2BbnEMLVbN0dn4b7n7hZhdonlFC7jg%3D "How do I effectively navigate the Clario Global Dashboard_ (3) - Step 13.png")
5. This guided tutorial quickly tours you around the Global Dashboard. The pink circles seen in the bottom left of the message indicate your progress; there are five messages that will show. The action buttons - Close and Next - appear in the bottom right of the message. Click Close to exit the message or Next to progress to the next message screen.

6. You can provide us with feedback by clicking Provide Feedback. You'll then need to select the feedback Type, write your feedback in the Message box, and press Submit.
 - Step 15.png?sv=2022-11-02&spr=https&st=2025-04-25T19%3A41%3A45Z&se=2025-04-25T19%3A51%3A45Z&sr=c&sp=r&sig=myrYs03At0%2F2Hw%2BbnEMLVbN0dn4b7n7hZhdonlFC7jg%3D "How do I effectively navigate the Clario Global Dashboard_ (3) - Step 15.png")
7. You may also notice a Customer Care link in the last line of the NOTE text. You can click this link to bring up Customer Care's contact information.
Finally, as with all of the other sections, you can collapse this section by pressing the down arrow next to the word "Dashboard".
 - Step 16.png?sv=2022-11-02&spr=https&st=2025-04-25T19%3A41%3A45Z&se=2025-04-25T19%3A51%3A45Z&sr=c&sp=r&sig=myrYs03At0%2F2Hw%2BbnEMLVbN0dn4b7n7hZhdonlFC7jg%3D "How do I effectively navigate the Clario Global Dashboard_ (3) - Step 16.png")
8. The section titled Recently Accessed will likely be one of your most used areas of the Global Dashboard. This section lists each of the studies you recently accessed. Go here to quickly access your Study Dashboard.
 - Step 17.png?sv=2022-11-02&spr=https&st=2025-04-25T19%3A41%3A45Z&se=2025-04-25T19%3A51%3A45Z&sr=c&sp=r&sig=myrYs03At0%2F2Hw%2BbnEMLVbN0dn4b7n7hZhdonlFC7jg%3D "How do I effectively navigate the Clario Global Dashboard_ (3) - Step 17.png")
Finding your footing in the Global Dashboard footer
1. You may not use the links or information shown in the Global Dashboard footer. They're still good to know about. Each link opens in a new web browser tab. The information about the page you're on (i.e., the Global Dashboard) is located in the bottom right. This information comes in handy when you're troubleshooting matters with Customer Care regarding the Clario Portal.
 - Step 18.png?sv=2022-11-02&spr=https&st=2025-04-25T19%3A41%3A45Z&se=2025-04-25T19%3A51%3A45Z&sr=c&sp=r&sig=myrYs03At0%2F2Hw%2BbnEMLVbN0dn4b7n7hZhdonlFC7jg%3D "How do I effectively navigate the Clario Global Dashboard_ (3) - Step 18.png")
![]()
この記事は役に立ちましたか?