Effectively monitoring queries
- 26 Aug 2024
- 4 Minutes to read
- Print
- DarkLight
- PDF
Effectively monitoring queries
- Updated on 26 Aug 2024
- 4 Minutes to read
- Print
- DarkLight
- PDF
Article summary
Did you find this summary helpful?
Thank you for your feedback
Overview
Starting from your Imaging-specific Study Dashboard, select Queries.
Refine your search criteria to find your target query and then press Apply to execute the search.
View and take action on a query after pressing the ellipse (…) and then View.
Press Respond from within the View Query screen to comment on queries and/or press Go To Task to take action (e.g., upload a new file).
Information Scope
Solution: Medical Imaging
Platform: NxT
Expand for detailed instructions…
Searching and sorting the Queries table
1. Starting from the Study Dashboard, select Queries.
 - Step 1.png?sv=2022-11-02&spr=https&st=2025-05-19T22%3A26%3A57Z&se=2025-05-19T22%3A36%3A57Z&sr=c&sp=r&sig=xF5t9388W21zhcNWl2qGG9ePpB4Gh9ygiPVv%2BMQ12O8%3D "How do I use the Queries service_ (2) - Step 1.png")
2. You can search for specific queries shown in the table.
Expand to learn more about applying search filters…
The search parameters are automatically set to search data in all columns, Search all. You can refine the search parameters to search data within a specific column. Remember that searches can also result in no data. When this occurs, clear the search and start over.
Configure search parameters by pressing the drop down arrow next to Search all and select the column header name (e.g., Category, Generated, Status, etc.).
Type your keywords into the text box where the Search all disappearing text is displayed.
Not all search parameters require you to enter free text. Some require that you select from a second predefined list of options. For instance, when you elect to search by Status, you'll then need to select from a second list of options.
Click Apply.
Multiple filters can be applied by repeating the search process. For instance, you can first filter on the Site column and next on the Subject column. The two filters will display. You can clear them individually by pressing x or clear them together by pressing Clear all.
 - Step 2.png?sv=2022-11-02&spr=https&st=2025-05-19T22%3A26%3A57Z&se=2025-05-19T22%3A36%3A57Z&sr=c&sp=r&sig=xF5t9388W21zhcNWl2qGG9ePpB4Gh9ygiPVv%2BMQ12O8%3D "How do I use the Queries service_ (2) - Step 2.png")
3. As you progress in your clinical trial, your Queries table may grow larger and larger. In this case, toggling the amount of data that's displayed on a single page may be useful. You can adjust the number of data rows by tapping the drop down arrow displayed next to 10.
By default, a table displays 10 (ten) rows of data.
Expand to learn more about moving between multiple pages…
When you have multiple pages of rows, you'll be able to navigate through them using the forward and back arrows. These buttons are greyed out and not clickable when the number of rows do not exceed your configuration (e.g., "10").
The single arrow indicates moving one page at a time.
The double arrow indicates moving directly to the beginning or ending page.
 - Step 9.png?sv=2022-11-02&spr=https&st=2025-05-19T22%3A26%3A57Z&se=2025-05-19T22%3A36%3A57Z&sr=c&sp=r&sig=xF5t9388W21zhcNWl2qGG9ePpB4Gh9ygiPVv%2BMQ12O8%3D "How do I use the Queries service_ (2) - Step 9.png")
4. The data in the table is organized under column headers.
The column headers are shown with up and down arrows next to their titles. You can sort the table by pressing the column header and/or the up/down arrows.
Sorting can only be applied to one column at a time. Sorting a second column clears the first column sort automatically.
You will be able to view summary information for each of the subjects associated with the sites you're managing in the main body of the table. Click the row for your target subject to launch a subject-specific page.
You'll then notice ellipses (i.e., three dots, ...) at the end of each row. Hover your pointer over these dots to bring up a new menu of actionable options.
 - Step 12.png?sv=2022-11-02&spr=https&st=2025-05-19T22%3A26%3A57Z&se=2025-05-19T22%3A36%3A57Z&sr=c&sp=r&sig=xF5t9388W21zhcNWl2qGG9ePpB4Gh9ygiPVv%2BMQ12O8%3D "How do I use the Queries service_ (2) - Step 12.png")
Viewing and taking action on queries
1. To view query details, more than what is shown in the table, press the ellipse (i.e., three dots, “...”) shown in the row of your target query and next to the Category column. Notice how the row of the query you intend to view will change color when you hover your mouse over it. Then press View.
 - Step 15.png?sv=2022-11-02&spr=https&st=2025-05-19T22%3A26%3A57Z&se=2025-05-19T22%3A36%3A57Z&sr=c&sp=r&sig=xF5t9388W21zhcNWl2qGG9ePpB4Gh9ygiPVv%2BMQ12O8%3D "How do I use the Queries service_ (2) - Step 15.png")
2. Once in the View Query page, you can take a couple of actions.
You can exit the page by pressing the x shown in the top right corner of the pop-up screen.
You can also respond to the query by pressing Respond. This will open a new text box for you. You'll enter your response by clicking in the text box where the Type here disappearing text is shown. Then you'll type your response and press Submit when you’re done.
Pressing the Go To Task button launches the View/Upload data page that is linked to the query. It’s here where you’ll be able to upload new files per the Suggested Resolution.
 - Step 16.png?sv=2022-11-02&spr=https&st=2025-05-19T22%3A26%3A57Z&se=2025-05-19T22%3A36%3A57Z&sr=c&sp=r&sig=xF5t9388W21zhcNWl2qGG9ePpB4Gh9ygiPVv%2BMQ12O8%3D "How do I use the Queries service_ (2) - Step 16.png")
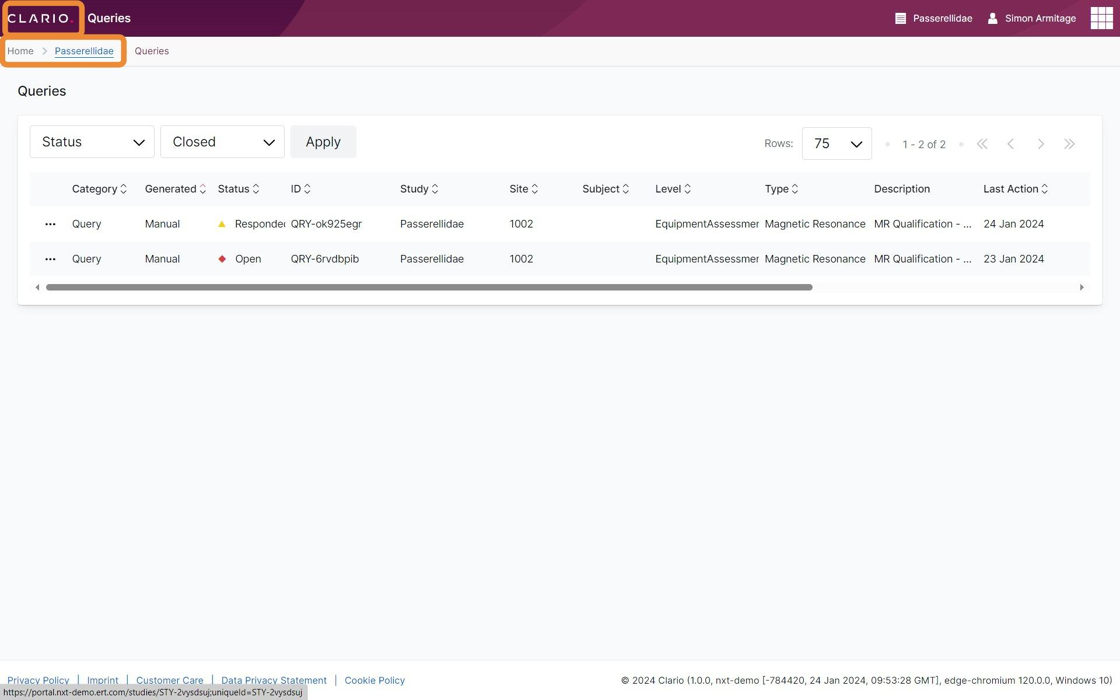
7. Once you've responded to the query, the Status changes from Open to Responded.
 - Step 21.png?sv=2022-11-02&spr=https&st=2025-05-19T22%3A26%3A57Z&se=2025-05-19T22%3A36%3A57Z&sr=c&sp=r&sig=xF5t9388W21zhcNWl2qGG9ePpB4Gh9ygiPVv%2BMQ12O8%3D "How do I use the Queries service_ (2) - Step 21.png")
Exiting the Queries page
1. You can now exit the Queries page.
Press the back arrow next to the page title, Queries, that’s shown above the data table.
Press the clinical trial's name (e.g., "Passerellidae") shown next to the Queries navigation link. This action returns you to the Study Dashboard.
Press Home to return to the Global Dashboard.
Press CLARIO. to also return to the Global Dashboard.
![]()
Was this article helpful?